The borough average reached an all-time high in June, up £11,579 in a year. Northumberland next door rose fastest in England and is now the dearer place to buy.
The average home in North Tyneside sold for £203,813 in June, the highest figure the borough has ever recorded. Prices are up £11,579, or 6.0%, on June last year, according to the Land Registry’s UK House Price Index, published on 19 August.
That is a sharp turn. As recently as March the borough average was £196,145 and falling, down 0.4% on the year. It has gained £7,668 in the three months since, including 2.0% in June alone.
Three times the England rate
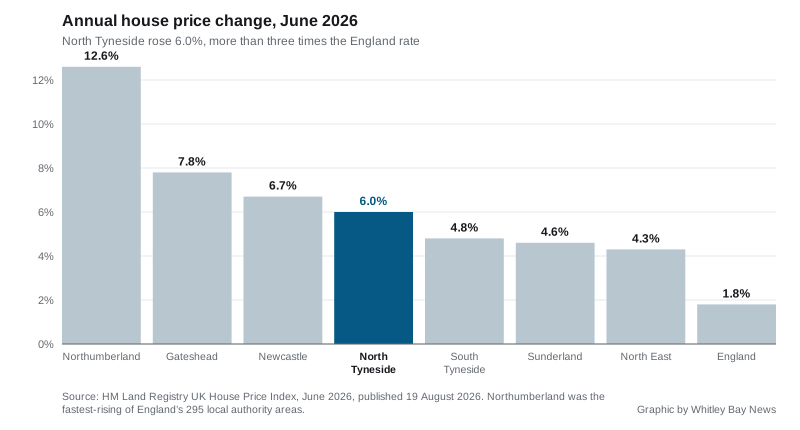
North Tyneside is rising far faster than the country as a whole. England’s average rose 1.8% over the same year, to £293,262. The North East as a region rose 4.3%, to £165,550.
Set against all 295 local authority areas in England, North Tyneside’s 6.0% ranks 48th. Sixty-two of those areas saw prices fall over the year. The borough is not one of them.
Northumberland has overtaken the borough
The striking number in this release is not ours. Northumberland rose 12.6% over the year, the fastest of any local authority area in England, and its average is now £213,452. The county next door has gone from cheaper than North Tyneside to £9,639 dearer.
Around the rest of Tyne and Wear:
| Area | Average, June 2026 | Annual change |
|---|---|---|
| Northumberland | £213,452 | +12.6% |
| Newcastle upon Tyne | £208,589 | +6.7% |
| North Tyneside | £203,813 | +6.0% |
| South Tyneside | £161,372 | +4.8% |
| Gateshead | £158,254 | +7.8% |
| Sunderland | £143,216 | +4.6% |
Gateshead is the other mover, up 7.8% and 20th in England, though from a much lower base. Sunderland and South Tyneside are both still under £165,000.
What sort of home, and what it costs
The borough average hides a spread of more than £260,000 between a flat and a detached house.
| Property type | Average | Annual change |
|---|---|---|
| Detached | £380,496 | +5.6% |
| Semi-detached | £231,554 | +6.9% |
| Terraced | £200,873 | +6.8% |
| Flat | £119,543 | +3.7% |
Semis and terraces are pulling the average up. Flats are the laggard at 3.7%, which matters in the coastal parts of the borough where flats are a large share of what sells.
A first-time buyer in North Tyneside paid an average of £177,366 in June, up 6.2% on the year.
Read the number carefully
Two health warnings, and neither is small.
The UKHPI average is a mean, not a median. A handful of expensive sales pulls it upward, so it sits above what a typical buyer pays. It is not the price of an average house so much as the average price of the houses that sold.
Recent months get revised. The Land Registry keeps adding completed sales to a month after first publishing it. May was first released at £200,392, an annual rise of 3.8%; this month’s file cuts it to £199,887 and 3.5%. June’s figure will move too. Sales volumes are the same story: the count is blank for May and June, and the most recent published month is April, with 161 sales.
What it means for you
- If you are selling, the direction has changed since spring. The borough average has recovered its March dip and passed its previous peak.
- If you are buying, a 6.0% year is £11,579 added to the average price, well ahead of the 1.8% England figure.
- If you were looking at Northumberland as the cheaper option, that is no longer true on these figures. It has been the fastest-rising area in England over the past year.
- Do not treat June’s £203,813 as settled. It is a first release, and May’s was revised down by £505 within a month.
Our Whitley Bay house prices page covers town-level sold prices and how the coast compares with the rest of the borough. Planning decisions on new housing across the borough are on our planning news page.
Have your say
We read every message. To comment on this story, email the newsdesk and we may publish a selection of responses: hello@whitleybaynews.co.uk.