
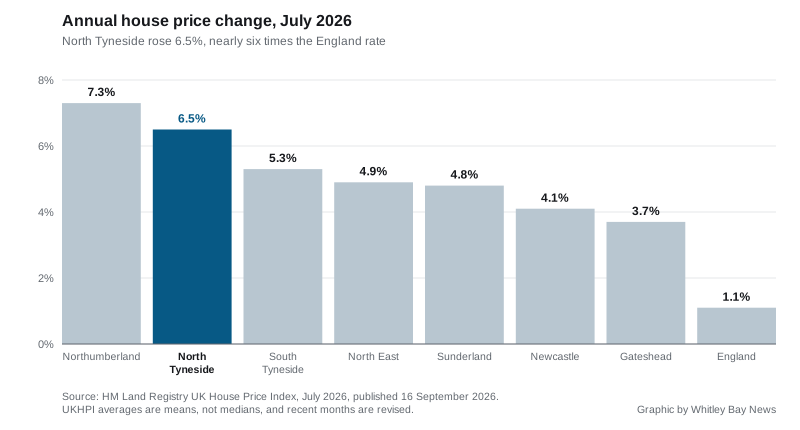
The borough average rose £12,527 in a year to £205,744 in July, nearly six times England's pace. Semis led at 7.8% while flats managed just 3.4%.
The average home in North Tyneside sold for £205,744 in July, a record for the second month running. Prices are up £12,527, or 6.5%, on July last year, according to the Land Registry’s UK House Price Index, published on 16 September.
England as a whole rose 1.1% over the same year, to £293,479. The borough is rising at nearly six times that pace, and faster than the North East region’s 4.9%.
£1,803 behind Newcastle
The borough is also closing in on its neighbour. Newcastle’s average was £207,547 in July, up 4.1% on the year. That leaves North Tyneside £1,803 behind, with the gap narrowing.
| Area | Average, July 2026 | Annual change |
|---|---|---|
| Northumberland | £212,563 | +7.3% |
| Newcastle upon Tyne | £207,547 | +4.1% |
| North Tyneside | £205,744 | +6.5% |
| South Tyneside | £161,559 | +5.3% |
| Gateshead | £155,550 | +3.7% |
| Sunderland | £147,114 | +4.8% |
Northumberland stays top of the local table. The June release had put it top of all England at 12.6%; its July figure is a calmer 7.3%, but the county remains £6,819 dearer than North Tyneside.
Semis are doing the work
The spread between property types is now more than £260,000.
| Property type | Average | Annual change |
|---|---|---|
| Detached | £382,435 | +6.5% |
| Semi-detached | £234,125 | +7.8% |
| Terraced | £203,368 | +7.2% |
| Flat | £120,343 | +3.4% |
Semi-detached homes led again at 7.8%, with terraces close behind. Flats rose 3.4%, less than half the borough rate, which matters on the coast where flats are a large share of what sells.
A first-time buyer in North Tyneside paid an average of £179,153 in July, up 6.6% on the year.
June was revised up, not down
When we reported the June figures, we warned that first releases move. They moved, and this time upwards. June was first published at £203,813 and a 6.0% annual rise; this month’s file lifts it to £204,818 and 6.5%. July’s £205,744 will be revised too.
The same lag affects sales counts. July and June show no sales figure yet, and the most recent months on record, April and May, show 175 and 169 sales. Those counts rise as more completed sales are registered: April was 161 when we reported it last month.
One more health warning, unchanged from last month. The UKHPI average is a mean, not a median. A handful of expensive sales pulls it upward, so it sits above what a typical buyer pays.
What it means for you
- If you are selling, the borough has now set two record averages in a row, and the annual rate has held at 6.5% for two months.
- If you are buying, a 6.5% year adds £12,527 to the average price. Waiting has been expensive in this market.
- If you own a flat, the headline number is not your number. Flats are rising at 3.4%, and the gap with houses is widening.
- If you were weighing Northumberland as the cheaper option, it is still dearer than the borough and still rising faster.
Our Whitley Bay house prices page covers town-level sold prices and how the coast compares with the rest of the borough. Decisions on new housing across the borough are on our planning news page.
Have your say